The University has one of the highest four-year graduation rates in the country. In fact, U.S. News and World Report cited a four-year graduation rate of 87 percent for the University, ranking it No. 30 in a list of peer institutions with the highest four-year graduation rates based on data from the class of 2012.
According to data collected by University Institutional Assessment and Studies, 88.8 percent of students who enrolled at the University in the fall of 2012 graduated in May 2016, marking a .5 percent increase in the four-year graduation rate from the class of 2015. The rate has increased over the past decade, making it the highest in the University’s history. The four-year graduation rate was 82.7 percent in 2004, 86.7 percent in 2009 and 87.9 percent in 2014. The current rate is 8.5 percent higher than it was in 1992, the earliest year for which IAS has published data.
While the University has seen a general increase in the four-year graduation rate, the numbers vary noticeably when compared across different schools and students of different races.
Graduation rates by school
Graduation rates at the University are high across the board, but there is some variation when the number is broken down by school.
Just over a decade ago, the four-year graduation rate for the Engineering School was noticeably lower than other schools. In 2004, the College and the Architecture School both had an 83.5 percent four-year graduation rate, while the rate for the Nursing school was .2 percent higher. However, the rate for Engineering — at 78.8 percent — was 4.7 percent lower than the College rate.
In 2009, Architecture and Nursing both had higher four-year rates than the College rate of 86.9 percent, with rates of 95.1 percent and 90.9 percent, respectively. However, the Engineering rate was still lower, at 83.5 percent.
In recent years, the gap among schools has narrowed, and the Engineering school has had higher graduation rates than the College since 2014. For the class of 2016, the four-year College rate was 88.5 percent, the Engineering rate was 89.1 percent, the Architecture rate was 90.4 percent and the Nursing rate was 100 percent.
Although the numbers change when looking at the five- and six-year graduation rates, similar trends and fluctuations are evident. The Engineering School has had some of the lowest rates over the past decade, while the Nursing school has had some of the highest rates.
IAS did not provide historical data for the Curry School of Education.
Graduation rates by race
The overall increase in graduation rates over the past 12 years is also seen when the graduation rate is broken down by race.
Although students who identify as African-American have had some of the lowest four-year graduation rates over the past 12 years — along with American Indian and Native Alaskan students in 2004, 2014 and 2015 and non-resident alien students in 2016 — the rate itself for African-American students has increased by 5.5 percent since 2004.
Similarly, the four-year graduation rate for Hispanic students has increased by 12.6 percent, the rate for Asian students has increased by 6.9 percent and the rate for white students has increased by 5.8 percent.
Until last May, Asian students have consistently had some of the highest four-year graduation rates, along with American Indian and Native Alaska students in 2009 and Native Hawaiian and Pacific Islander students in 2015. However, in 2016, Hispanic students graduated at a rate of 92.4 percent — 1 percent higher than the rate for Asian students. This rate is also 2.8 percent higher than the rate for white students, 89.6 percent, and 11.5 percent higher than the rate for African American students, 80.9 percent.
AA= African American
Alaska Native= American Indian or Alaska Native
NR Ailen= Non- Resident Alien
Unknown= Race and Ethnicity Unknown
Graphic By Kriti Sehgal
The four-year graduation rates for other races are far less stable. For instance, 70 percent of students who identified as American Indian or Alaska Native graduated in 2004, and this number increased to 100 percent in 2009. However, it fell to 66.7 percent in 2014 and was 85.7 percent last May. However, according to University enrollment numbers from the 2015-16 school year, American Indian and Alaska Native students made up just 0.2 percent of the student body.
The rate for students who identified as non-resident aliens also fluctuated, but to a lesser degree. 82.5 percent of non-resident aliens graduated in 2004, 80.9 percent graduated in 2009, 86.1 percent graduated in 2014 and 79.2 percent graduated last May.
Vicki Gist, the assistant dean of students and director of Multicultural Student Services, did not address causes of the general increase in graduation rates but did point out that many schools within the University have deans of Diversity and Inclusion who focus on the educational experience of minority students.
“Generally, I will say that several factors — such as academic support, first-year retention, early intervention and culturally relevant support services — play a role in this success, and there are many people and departments at the University who do great work in these areas,” Gist said in an email statement. “Within the Division of Student Affairs, the Office of African-American Affairs is a great example of this.”
Moving forward, Gist says she and the Office of the Dean of Students hope to help sustain the upward trend.
“One of many goals we have is to incorporate academic support initiatives into the already robust menu of mentoring, leadership and cultural programs offered through Multicultural Student Services,” Gist said. “The new Multicultural Student Center will be a great home-base for this.”
Being a fifth- or sixth-year
There are several reasons why a student may not graduate in four years. Hannah Guffey, a career counselor for the University’s Career Center, said many students choose to take time off for professional development. Guffey has worked with students who took leaves of absence from the University to pursue internships, work experience and positions abroad.
However, Guffey also said some students leave the University because of unforeseen personal or financial difficulties.
“We work really intentionally with those students to provide that support in developing personal plans and narratives for how they can figure out how to reflect what this time looks like for them as they transition back into an academic environment,” Guffey said.
The University Career Center provides individual counseling and career support for those students and connects them to other helpful resources such as the Office of the Dean of Students, Guffey said.
“I understand, from a student perspective, how [not graduating in four years] can be perceived as a challenge because they don’t have a similar or the same cohort of students that they’re kind of measuring themselves against, so their story and their path is going to look a little bit different, so inherently I feel like it’s going to feel harder,” Guffey said. “From a career counselor perspective, I don’t see that as a negative by any means. It by no means should be or is a deterrent to employers who are looking to recruit students for different positions.”
Like Guffey, fourth-year Engineering student Christina Lee does not view staying at the University for more than four years as a disadvantage. Though Lee never took time off from school, she transferred to the University in the spring of her second year and began her studies in the Engineering School the next fall. After her transfer, she would have had to take 21 credits per semester in order to graduate in four years, so she decided to stay for a fifth year.
“I decided that I wanted to have extra time to be able to pursue research interests as well as get the opportunity to be a teaching fellow,” Lee said. “It ended up being advantageous for me because I have a very broad interest in things not only in engineering but also in the College, so it’s given me a lot of opportunities to take classes that if I had decided to graduate in four years, I wouldn’t have had the opportunity to take.”
She also said she was able to form strong relationships with her peers, including students in the class of 2017 and the class of 2018. Lee will graduate with the class of 2018, and she intends to pursue graduate school.
All data for this article was compiled by Ron Pack, a systems analyst for IAS, and sent via email to The Cavalier Daily from Christina Morell, associate provost and director of IAS.
Read More
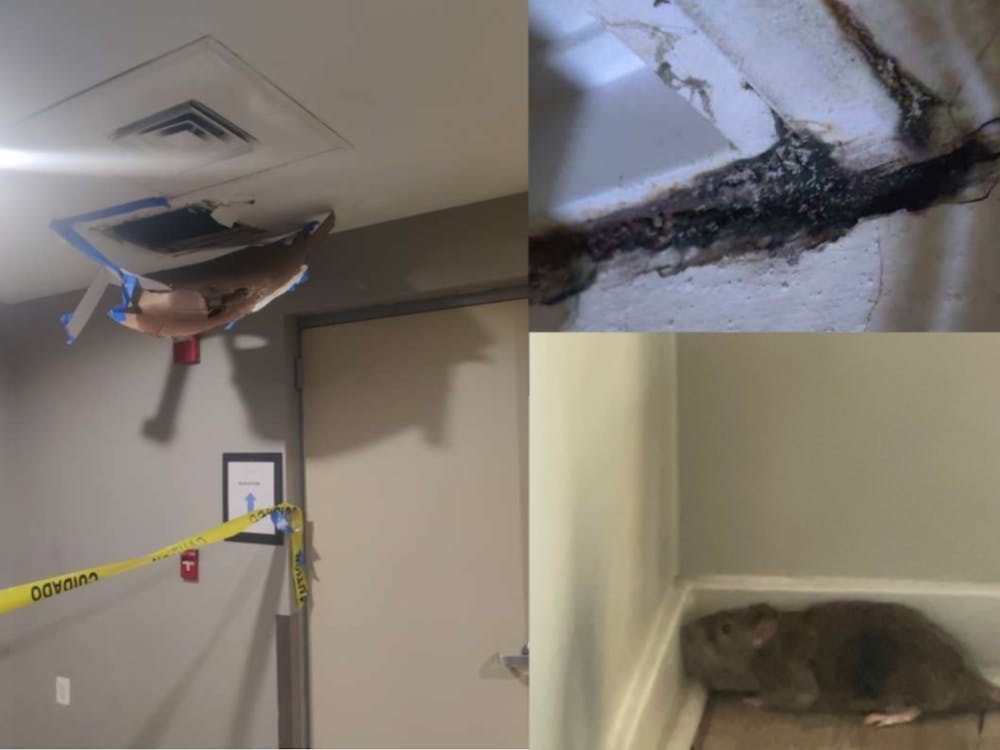
U.Va. Architecture lecturer under fire for recurring housing violations
By Merrill Hart | January 30, 2024Despite Chapman Development’s attempts to implement new management systems, residents have reported a continued failure to address basic health and safety issues across Chapman’s properties.
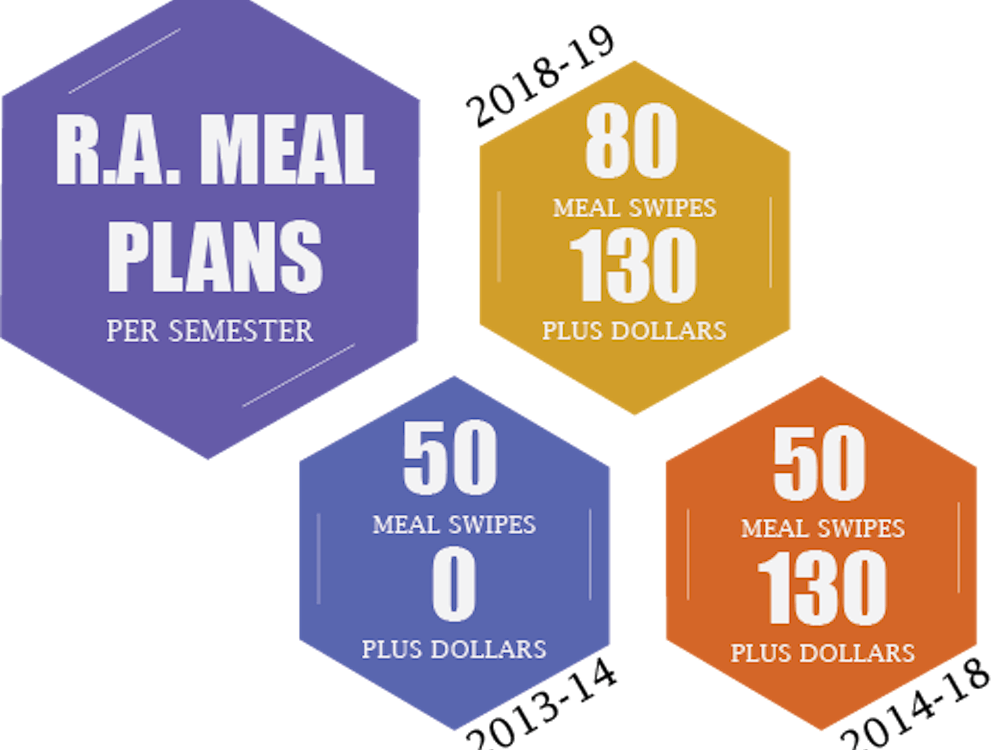
Evaluating the Resident Advisor compensation plan
By Karina Atkins | January 15, 2019Despite recent increases, some former RAs say that the compensation package is not extensive enough to ease the difficulties they faced providing meals for themselves.
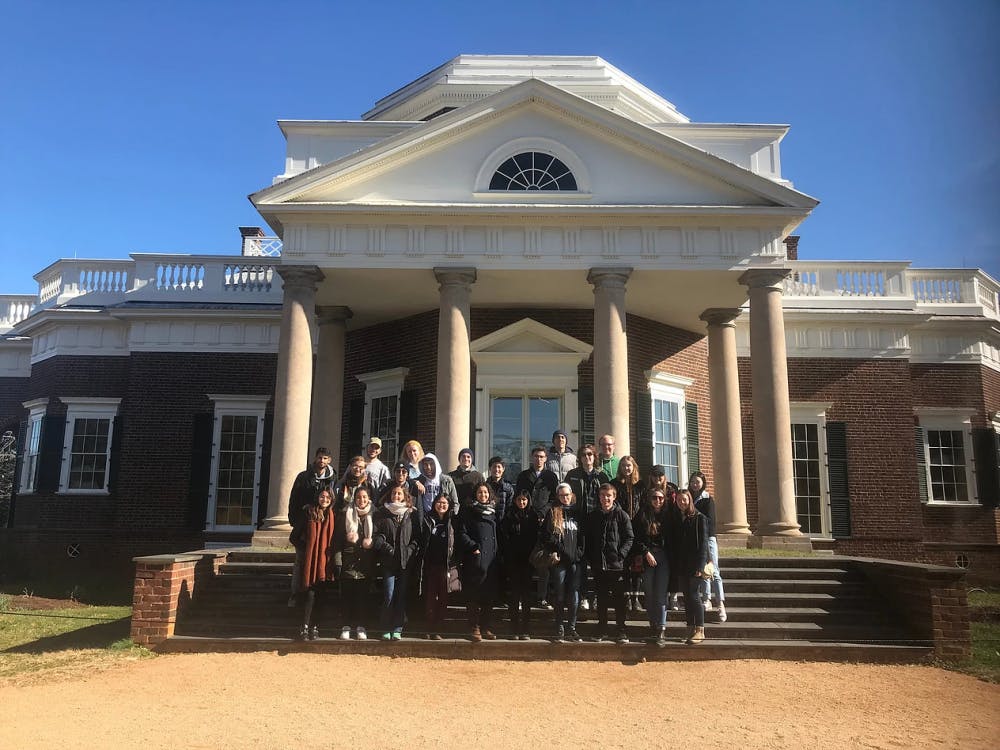
Exchange students at U.Va. prepare for a bittersweet end
By Carolyn Lane | December 5, 2018As exchange students prepare for their journeys home, they get ready to leave behind the lives they have made in Charlottesville.
