The first results from the Asian Pacific Islander Desi American student survey conducted by two members of the Asian Student Union last year were released Feb. 1. Since a large amount of data was collected from nearly 900 respondents, the findings have been divided into several reports that will gradually be released in the coming months. The first report focuses on the demographics of the APIDA population at the University.
The survey, which launched in February 2020 and was open for a month, was divided into sections covering demographics, University services, student involvement, student climate and identity. Each of these five sections is expected to have its own separate report.
Only three other surveys on Asian American students have been conducted in the history of the University — one in 1988, one in 1993 and one in 2005. In spring 2019, Valerie Young, former ASU president and fourth-year College student, unearthed these surveys when looking through ASU’s archives. The following semester, Young and Kirtana Pathak, Class of 2020 alumna and former vice president of ASU, began a year-long independent study under the supervision of Prof. Sylvia Chong, director of the Asian Pacific American Studies minor, to design a new survey of the APIDA population.
“The main purpose has been to show that there is a disparity among different Asian American groups,” Pathak said. “I think that the report does a good job of highlighting that not everyone at U.Va. who is Asian or Asian-international is the same person, has the same resources or the same perspective on things.”
Young and Pathak conducted outreach through social media and reached out to student organizations to help share the survey with the APIDA population. This latest survey included responses from 890 APIDA students with a response rate of approximately 29.7 percent, surpassing Young and Pathak’s initial goal of 20 percent. The survey also included responses from international students — who made up 11 percent of all respondents — and graduate students — who made up 12 percent of all respondents. These two groups were not included in previous surveys of the Asian American population.
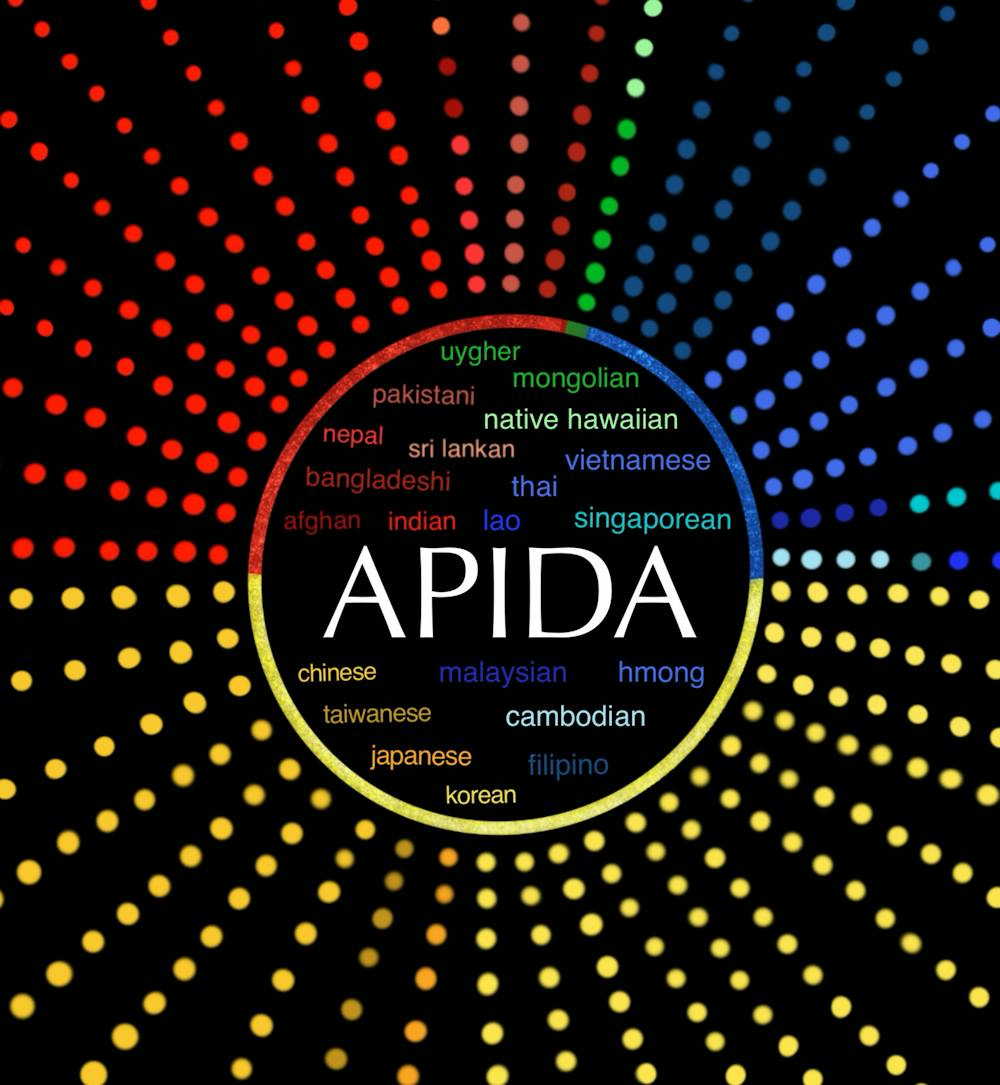
The University’s Diversity Dashboard has broad identity categorizations, only including the categories of “Asian American” and “Native Hawaiian or Pacific Islander” to represent the APIDA population. One of the goals of the survey was to provide a breakdown of the ethnicities that make up the University’s APIDA population, because, according to Pathak, the University’s broad categorizations make it “harder to see differences within ethnicities.” The report divided ethnicities into the categories of East Asian American, South Asian American, Southeast Asian American and Other, which includes Central Asian Americans and Pacific Islanders. Within each category are various subgroups.
According to the report, the greatest number of Asians and Asian Americans at the University are East Asian — 51.5 percent of respondents — followed by South Asian — 31 percent of respondents. The largest groups of APIDA students are Chinese Americans, who made up 29.7 percent of all respondents, followed by Indian Americans, who made up 22.8 percent of all respondents. This is consistent with national Asian demographics. Korean Americans, Vietnamese Americans and Filipino Americans are the next largest APIDA groups at the University, making up 16 percent, 9.6 percent and 7.2 percent of all respondents, respectively.
Only 0.2 percent of the survey respondents identified themselves as Pacific Islanders, whereas they make up 7.1 percent of the national APIDA population and 6 percent of Virginia’s APIDA population. According to the University’s Diversity Dashboard, in 2019, only 0.07 percent of the total undergraduate population identified as Native Hawaiian or Pacific Islander.
In the preface to the results, Chong described how Asian Americans are often neglected when it comes to thinking about racial politics and are instead grouped under white people due to presumptions about their economic privilege, despite also being a minority group.
The demographics results report disaggregates data and is intended to inform the University community about the diversity of the APIDA population. By portraying the different experiences and disadvantages faced by members of the APIDA population, the results also seek to correct the “model minority myth” — the stereotype that Asian Americans are able to attain educational and financial success and thus serve as a “model” for other minority groups.
“While this is not to say that APIDAs face the same challenges and/or level of discrimination that other racialized minority and indigenous groups face, we must not presume that APIDAs are uniformly privileged or that their economic or educational privileges protect them from the macro- and micro-aggressions of racism and xenophobia,” Chong wrote in the preface.
Several sections of the report are dedicated to distributions of variables by generation and ethnicity.
When undergraduate household income was grouped by ethnicity, it was discovered that compared to other Asian ethnicities, a higher proportion of South Asian American respondents — 52 percent — are in the highest income bracket, making over $150,000. A lower proportion of South Asian American respondents — 11 percent — are in the lowest income bracket, indicating a family income of less than $50,000.
According to the report, graduate students were not asked about their household income because they are usually independent and as a result have lower household incomes that may not be representative of family economic privileges.
Within all other ethnicity groupings, 20 to 22 percent reported household income in the lowest bracket. Southeast Asian American and Asian international student households were revealed to be much less likely to be in the top income bracket compared to East and South Asian American households.
As a whole, about 60 percent of APIDA students reported income in the bottom three brackets while the median household income range for APIDA students is in the $100,000 to $150,000 bracket.
“Every single ethnicity grouping or every single generational group has its own tendencies that are completely different from others,” Young said. “Even though we don’t know the concrete reasons behind why, [for example] some ethnicities go towards one major compared to another, it’s really interesting to look at how U.Va.’s Asian population varies so much.”
When grouping undergraduate household income with languages spoken, it was discovered that the below $50,000 income bracket had a slight majority of individuals who spoke a foreign language only. On the other hand, individuals who spoke English only or who were multilingual had more representation in the upper income brackets. 66.6 percent of APIDA households speak other languages at home, and 74.5 percent of APIDA households speak English some or all of the time.
Compared to other groups, a higher proportion of South Asian Americans speak a foreign language while Southeast Asian families have the greatest proportion of English-only speakers.
The majority — 63 percent — of respondents are second-generation students, meaning that they were born in the United States and have two parents who immigrated. 20 percent are first-generation students.
When generation is grouped by ethnicity, South Asian Americans have the lowest proportion of 2.5+ generation students — students with one or more parents born in the U.S. Southeast Asian Americans have the largest proportion of 2.5+ generation students.
Over half of first-generation households speak only in a foreign language, and 39 percent speak in both English and a foreign language. For second-generation households, the percent speaking two or more languages, including English, increases to 53 percent. In households past 2.5+ generations, however, 84 percent speak English only.
The day the report was published, Young and Pathak sent out a wave of emails to leaders of student organizations and University administration, faculty and staff — including people from the Office of Admissions, the Office of the Dean of Students and the Office for Diversity, Equity and Inclusion — to share their results.
Young and Pathak hope that their results can help the University determine what the Asian American community’s current needs are. Although this report focused solely on demographics, following reports will explore APIDA experiences at the University specifically.
“I don’t think we can be too optimistic especially since the University has so much on its plate,” Young said. “But we would really hope for the University to provide more resources and spaces for Asian and Asian American students.”
The results also match ethnicities to majors. 63.4 percent of respondents are majoring in a STEM-related field, compared to 22.5 percent of all students at the University. Within every single ethnic group, STEM majors are the most popular, but they are especially popular among East and South Asian Americans. First-generation students have the highest proportion of STEM majors.
The report attributes the fact that second-generation students and beyond may have more representation in humanities, social science and professional fields “because their generation status affords them higher levels of English language proficiency, cultural assimilation and social capital in the U.S., which allows them access to the “soft” skills required by these majors.” A significantly larger number — 17 percent — of third-generation students have entered the professional field than any other generation. Majors defined as professional include majors in the Frank Batten School of Leadership and Public Policy, the School of Education and Human Development, the McIntire School of Commerce, the School of Nursing and the School of Architecture.
While this first report was released a year after the survey initially opened, the following reports are expected to take less time. All the data from the survey has already been cleaned and analyzed, so it’s just a matter of making charts and writing the actual report.
Because Pathak has already graduated and Young is graduating this year, the second report is being taken on by two other members of the ASU executive board — second-year College student Steven Jiang and third-year College student Kathryn Gatuslao. According to Jiang, the second report should hopefully be complete by the end of the semester, and if not, by the first few weeks of the next semester. They are still unsure, however, of who will succeed them in writing the following reports.
“Within the last five years, I think U.Va. has increased their initiatives focused on making sure that U.Va. remains an inclusive atmosphere for everyone,” Pathak said. “As these initiatives continue to happen, I think that the reports — all five of them or even this one — will remain invaluable for [the University] to understand what the student perspective is because it’s really hard I think for faculty to see what it’s like living as a student.
Read More

Luxury student-focused apartment building ‘Blume on Ivy’ to open fall 2027
By Melody Yuan | Yesterday“Picture this,” the Blume on Ivy website reads. “You wake up in your penthouse balcony apartment, start the day with a sunrise yoga class … all before your first lecture. Cold brew in hand, you head out caffeinated and ready.”

An overview of U.Va. Health’s executive leadership changes since February 2025
By Isabela Delgado | YesterdayU.Va Health’s administration has undergone multiple executive leadership changes over the past year.

‘We’re a team’ — Board of Visitors retreats to Morven for special accountability meeting
By Luca Bailey | 2 days ago“We’re a team,” Brown said. “It’s not Board [and] administration … we’re not competing. We’re trying to achieve a plan for U.Va. and ask, ‘how do we do it together?’”