University Medical Center nears top safety grade, looks to improve in November
The University Medical Center scored a “B” grade in the spring 2026 safety grades issued by the Leapfrog Group and is looking to improve its grade in the next round of scores
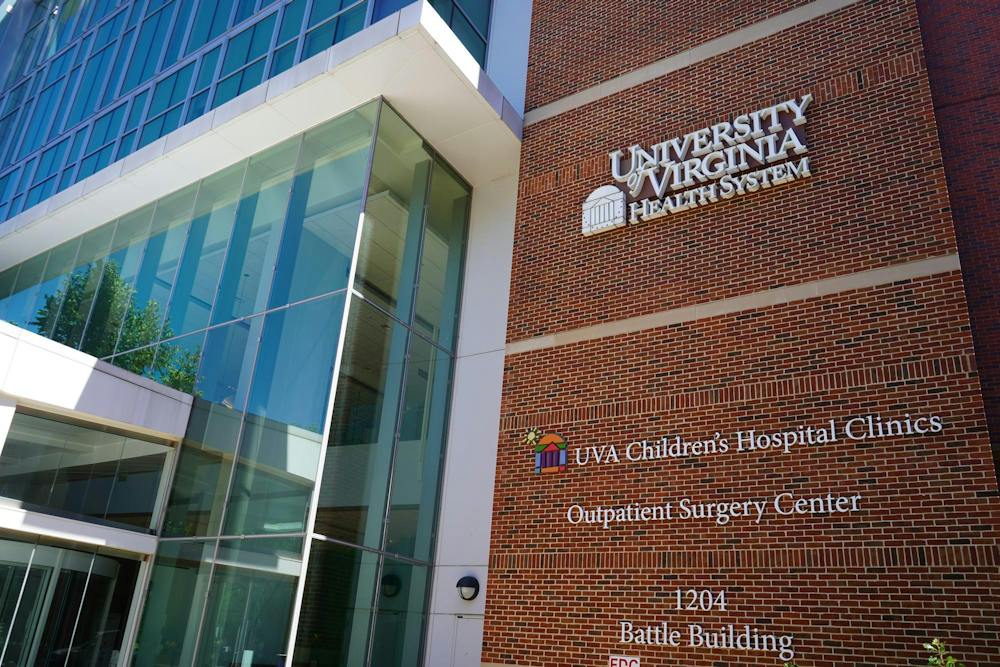
U.Va. Health Battle Building, photographed Sept. 14, 2022
Estimated reading time: 11 minutes
In the spring 2026 Leapfrog Hospital Safety Grades, the University Medical Center received a “B” grade — the second-highest grade awarded by The Leapfrog Group — with a numerical score of 3.18, just 0.02 points below the threshold for an “A.”
The Leapfrog Group is an independent nonprofit organization that evaluates hundreds of hospitals across the country on their performance in preventing medical errors, infections and other patient safety problems. The group publishes that information for patients in the form of safety grades and quality metrics on a biannual basis.
The Leapfrog Group hospital safety grades are composed of 22 patient safety measures that are divided between process and structural measures and outcome measures. The process and structural measures measure hospitals’ practices, such as medication safety, staffing, hand hygiene and communication with physicians and nurses.
The outcome measures analyze hospital-acquired conditions, health care-associated infections and other patient safety indicators. Each of the measures is weighted based on the frequency of the incident, the level of depth of data supporting it — which distinguishes if the data came from a primary or secondary source or whether there is missing data — and how much they vary from other facilities.
To calculate a hospital safety grade, Leapfrog compares each hospital's performance on each metric to the national average before combining the factors into a weighted score that is assigned a grade from “A-F.”
In Leapfrog’s spring 2026 grades, 917 hospitals, or 38.8 percent of those graded, received an "A.” Another 740 hospitals — 31 percent — received a “B,” while 646 — 27.3 percent — received a “C.” Fifty-five hospitals — 2 percent — received a “D” and five — 0.2 percent — received an “F.” Virginia ranked No. 2 for the state with the highest percentage of “A” grades.
Leapfrog releases hospital safety grades twice a year, with its spring 2026 grades released May 6 and its second set of grades for the year scheduled for release in November. Below is an analysis of the spring 2026 grades received by the University Medical Center — as well as U.Va. Health’s outlying hospitals in Culpeper, Haymarket and Prince William — and how the University Medical Center is working to improve its score for the next cycle of grades.
The University Medical Center tends to oscillate between receiving “A” and “B” grades. The University Medical Center received “A” grades in both fall 2023 and spring 2024, but has received “B” grades since fall 2024.
According to Eric Swensen, U.Va. Health’s public information officer, and according to the Leapfrog’s published methodology, current grades may include data that is up to four years old due to data processing lags and review periods.
In spring 2026, the University Medical Center received a high “B” grade, which puts it on par with that of another non-profit level 1 trauma center in the Commonwealth, Carilion Roanoke Memorial Hospital. The grade also places the University Medical Center behind two non-profit level 1 trauma centers — Inova Fairfax and the Virginia Commonwealth University Medical Center — which both received “A” grades, while ranking ahead of one other, Sentara Norfolk General Hospital, which received a “C” grade.
Virginia's level I trauma centers
Leapfrog Hospital Safety Grade, spring 2026
VCU Medical Center
Richmond
A
Inova Fairfax Hospital
Falls Church
A
University Medical Center
Charlottesville
B
Carilion Roanoke Memorial Hospital
Roanoke
B
Sentara Norfolk General Hospital
Norfolk
C
When analyzed across specific Leapfrog metrics, the University Medical Center had some of the highest scores in the country for implementing practices to prevent medical errors and assessing the performance of doctors, nurses and other hospital staff.
For the “handwashing” metric — which examines a hospital's hand hygiene policy, education and equipment — the University Medical Center scored 28 percent higher than the national average and received the maximum possible score. The University Medical Center also received maximum scores in the categories titled “doctors order medications through a computer” and “safe medication administration.” The University Medical Center scored 100 of 100 possible points in each and performed 20 percent and 16 percent better than the national average, respectively. It also received a maximum score of 120 in the category titled “staff work together to prevent errors,” performing 2 percent better than the national average.
According to Leapfrog’s methodologies, the “handwashing,” “doctors order medications through a computer” and “safe medication administration” categories use data that is self-reported from the facility, and if such data is not available, the hospital's prior scores are used. The “staff work together to prevent errors” category uses self-reported hospital data, but if the data is not available the metric is dropped. For the “communication about medications” and “communication about discharge” categories, Leapfrog uses independent data from the Centers for Medicare and Medicaid Services to calculate a score.
The University Medical Center's error-prevention practices versus the national average
Percentage difference between the University Medical Center's score and the national average for each measure. Higher scores are better. Orange indicates the University Medical Center performs better than average; navy indicates it performs worse than average.
Practices to Prevent Errors measures
Handwashing(best possible score)
+28%
Doctors order medications through a computer(best possible score)
+20%
Safe medication administration(best possible score)
+16%
Communication about discharge
+5%
Communication about medicines
+3%
Staff work together to prevent errors(best possible score)
+2%
Worse than averageBetter than average
Source: Leapfrog Hospital Safety Grade, spring 2026.
For the metrics including “effective leadership to prevent errors,” “nursing and bedside care for patients” and “specially trained doctors care for ICU patients,” the University Medical Center scored perfectly. The highest score that a hospital can receive in the categories for “communication with nurses” and “communication with doctors” is 100, and the University Medical Center received a score of 92 in both categories. The University Medical Center scored 45 percent and 25 percent better than the national average in those categories, respectively.
The highest possible score for the “effective leadership to prevent errors” category is 120, and similarly, the University Medical Center received a score of 120 in this category, scoring 2 percent better than the national average. Next, in the categories measuring communication with doctors and nurses, the University Medical Center did 2 percent better than the national average. Lastly, in the category “responsiveness of hospital staff,” the University Medical Center did 1 percent better than the national average.
According to Leapfrog’s published methodologies, for the category measuring “specially trained doctors caring for ICU patients” Leapfrog uses its own survey data as the primary data source. If no data is available, Leapfrog uses the hospital's previous data or an imputation model as the secondary source of data if data is unavailable. For the “nursing and bedside care for patients” and “effective leadership to prevent errors” categories, data is similarly taken from Leapfrog’s own surveys, but if data is unavailable the metrics are dropped. Lastly, for the categories that pertain to communication with nurses and doctors and the responsiveness of clinical staff, Leapfrog uses independent CMS data to determine a score.
University Medical Center's doctors, nurses and hospital staff practices versus the national average
Percentage difference between the University Medical Center's score and the national average for each "Doctors, Nurses & Hospital Staff" measure. Higher scores are better. Orange indicates the University Medical Center performs better than average; navy indicates it performs worse than average.
Doctors, Nurses & Hospital Staff measures
Nursing and bedside care for patients
+25%
Effective leadership to prevent errors
+2%
Specially trained doctors care for ICU patients
+2%
Communication with doctors
+2%
Communication with nurses
+1%
Responsiveness of hospital staff
+1%
Worse than averageBetter than average
Source: Leapfrog Hospital Safety Grade, spring 2026.
For surgical complications, the University Medical Center scored both better and worse than the national average across the different scoring metrics.
To start, the University Medical Center had a score for “accidental cuts and tears” during surgery that was 38 percent lower than the national average and their metric measuring “death from serious treatable complications” was 18 percent lower than the national average — indicating the University Medical Center has fewer occurrences of these events than the average.
However, its score for the metric measuring a “kidney injury after surgery” was 61 percent higher than the national average — indicating that the University Medical Center sees more kidney injuries following surgery than the average hospital.
The category for “dangerous object left in patient’s body” was 518 percent higher than the national average — however, this metric measures how many dangerous objects were left in a patient's body per 1000 patients, so the University Medical Scores indicates this only occurs for 1 in 14,706 patients.
Lastly, the University Medical Center’s score for measuring “blood leakage” from damage during surgery was 17 percent higher than the national average — indicating more accidental injuries.
According to Leapfrog’s published methodologies, data for all the aforementioned categories pertaining to surgical complications is pulled from independent CMS data.
University Medical Center's surgical complications versus the national average
Percentage difference between the University Medical Center's rate and the national average for each "Problems with Surgery" measure. Orange indicates the University Medical Center performs better than average; navy indicates it performs worse than average.
Surgery measures
Accidental cuts and tears
-38%
Surgical wound splits open
-24%
Death from treatable complications
-18%
Serious breathing problem
-13%
Blood leakage
+17%
Kidney injury after surgery
+61%
Dangerous object left in patient's body
+518%
Worse than averageBetter than average
Source: Leapfrog Hospital Safety Grade, spring 2026.
For common hospital-acquired infections — including MRSA, C. difficile, catheter-associated urinary tract infections and post-operative sepsis infections — the University Medical Center had scores that were mixed between better, on-par and worse than average. For the “catheter-associated urinary tract infections” category, the University Medical Center scored 29 percent lower than the national average, while its score for “sepsis infection after surgery” was 10 percent lower — a lower percent in these categories represents better outcomes.
For “MRSA” infections, the University Medical Center scored 37 percent higher than the national average. For “C. diff infections”, “post-operative colon surgery infections” and “bloodstream infections,” the University Medical Center scored 3 percent, 16 percent and 23 percent higher than the national average, respectively — indicating that these occurrences occur more frequently than the average.
According to Leapfrog's methodology, the aforementioned infection rate scores are primarily pulled from Leapfrog’s survey data. If that data is unavailable, then data is taken from CMS.
University Medical Center's infection rates versus the national average
Percentage difference between the University Medical Center's rate and the national average for each infection measure. Orange indicates the University Medical Center performs better than average; navy indicates it performs worse than average.
Infection measures
Urinary tract infection
-29%
Sepsis after surgery
-10%
C. diff infection
+3%
Colon surgery infection
+16%
Bloodstream infection
+23%
MRSA infection
+37%
Worse than averageBetter than average
Source: Leapfrog Hospital Safety Grade, spring 2026.
Lastly, for safety problem rates, the University Medical Center had the best possible score for “air or gas bubble in the blood” with zero cases occurring. Additionally, the metric tracking for “dangerous bed sores” was 25 percent lower than the national average.
The metric measuring “dangerous blood clots” was 23 percent higher than the national average, the score for “collapsed lungs” was 29 percent higher, the score for “falls causing broken hips” was 37 percent higher and the score for overall “patient falls and injuries” was 121 percent higher. These scores indicate these complications occur more frequently at the University Medical Center than the national average.
University Medical Center's safety-problem rates versus the national average
Percentage difference between the University Medical Center's rate and the national average for each safety-problem measure. Orange indicates the University Medical Center performs better than average; navy indicates it performs worse than average.
Safety Problems measures
Air or gas bubble in the blood(best possible score)
-100% (zero cases)
Dangerous bed sores
-25%
Dangerous blood clot
+23%
Collapsed lung
+29%
Falls causing broken hips
+37%
Patient falls and injuries
+121%
Worse than averageBetter than average
Source: Leapfrog Hospital Safety Grade, spring 2026.
All three of U.Va. Health’s outlying community hospitals — the Culpeper, Haymarket and Prince William Medical Centers — received “A” grades, the highest grade awarded by the Leapfrog Group, demonstrating a strong commitment to maintaining high-quality care and improving patient outcomes.
U.Va. Health's hospitals don't all grade the same
Leapfrog Hospital Safety Grade, spring 2026, across all four U.Va. Health hospitals.
U.Va. Health Culpeper Medical Center
Culpeper, Va. · Community hospital
A
U.Va. Health Haymarket Medical Center
Haymarket, Va. · Community hospital
A
U.Va. Health Prince William Medical Center
Manassas, Va. · Community hospital
A
U.Va. Medical Center
Charlottesville, Va. · Flagship academic medical center
B
Grade circles: orange for A, navy for B.
Source: Leapfrog Hospital Safety Grade.
At the last University Health System Board Quality Subcommittee meeting Aug. 27, the Subcommittee recognized the “A” grades for the community hospitals as an accomplishment for U.Va.
According to Swensen, the University Medical Center scored just shy of an “A” in the spring 2026 grade cycle. Swensen also said that because of the University Medical Center’s status as a “safety-net” hospital for the Commonwealth, it serves a large patient population with highly complex needs, which can contribute to worse outcomes.
Swensen said that U.Va. Health is still working to improve outcomes where possible by implementing programs such as the “Share to Solve” program.
“Like all hospitals, there are always opportunities to enhance patient safety, and we take that responsibility seriously," Swensen said. “Through our Share to Solve program, our team members use real-time data to drive daily discussions on how we can best provide the highest-quality patient care.”
According to Swensen, U.Va. Health has also deployed a program called “Ticket to Test,” which is a tool that helps clinicians and nurses decide when best to collect a urinary sample in hopes of reducing catheter-associated urinary tract infections. CAUTIs were one area where the University Medical Center did 29 percent better than the national average in spring 2026.
Another program focused on improving patient outcomes that Swensen discussed was an algorithm U.Va. Health developed called “U.Va. Magic.” U.Va. Magic provides support to U.Va. Health team members by helping them to select the appropriate type of catheter, using it only when necessary and removing it when it is no longer needed in an effort to reduce central-line-associated bloodstream infection rates. The University Medical Center did 23 percent worse than the national average in blood stream infections.
The Leapfrog Group will release a new set of grades in November.
Editor’s Note: The graphs included and the page design in this article were done by both OpenAI's ChatGPT and Anthropic's Claude. All writing, editing and reporting included is produced by The Cavalier Daily's staff.
Michael Racz
Michael Racz is a staff writer on the news desk. He is a second-year College student majoring in biology with plans to go to medical school. He enjoys writing about health topics and student self-governance.
The Commission will craft a report on the University Board of Elections’ current structure and governance practices, putting forth proposals for corrective action based on its findings.
The Board also received an orientation on changes to NCAA athletics, completed its annual Atlantic Coast Conference certification, heard a report from Aaron Bloomfield, Faculty Senate chair and engineering professor, and discussed the University’s ongoing searches for a provost and several deans.
As the school year begins to pick up, Dr. Eileen Chou, interim dean of the Frank Batten School of Leadership and Public Policy, discusses some of her plans for the school and shares her background. Chou spoke about leadership, excitement surrounding the opening of Batten’s new building and a bit about how she will balance her duties as interim dean while also staying connected with students and faculty.