Waitman Beorn, a lecturer in the Corcoran Department of History, has taken “a picture is worth a thousand words” to a new level. Specializing his studies on the Holocaust and Eastern Europe, Beorn undertook a digital humanities project to create an interactive map of the Lviv ghetto and Janowska concentration camp to analyze trends from this time.
The Janowska concentration camp was a Nazi camp established in Poland outside of what is now Lviv, Ukraine. According to Beorn, the concentration camp was a hybrid, serving as a transit camp, an extermination center and a slave labor camp. Beorn initially started studying the concentration camp alone, but then realized the importance of also covering the Lviv ghetto, one of the many ghettos that the Nazis established in order to segregate Jews.
Beorn obtained a list of 18,000 names of people who lived in the ghetto from the United States Holocaust Memorial Museum in Washington, D.C. The list contained a variety of information about the ghetto’s residents, including their names, birth dates, addresses, genders and jobs.
Beorn next reached out to Andrew Macqueen and Chris Gist in the Alderman Library Scholars Lab. Macqueen and Gist are specialists in geographic information system technology, which can be used to map data and visualize trends. Gist described GIS as working in a similar way to Google Maps.
“If you’ve ever used Google Maps, you can type in an address and it’ll zoom into a location,” Gist said.
According to Gist, Google Maps works with a top-down approach, in which the system tries to determine the exact location using address points entered into the system.
“If it doesn’t have an exact location, what it will then do is determine a range,” Gist said. “So, a street may have a range of addresses from one to nine on the left side and two to 10 on the right side. And so, if the address is five, it’s going to determine based on the length of that street, where on the road that address is.”
According to Macqueen, Beorn had a spreadsheet of addresses of workers and wanted to determine their location using GIS. Macqeen and Gist completed an initial pilot project with a single street and concluded that it was possible to get an idea of the location of the addresses. They then worked with the Center for Urban History of East Central Europe in Lviv to get data on the historical streets found in Beorn’s list. This data was used to code on the ground where the people lived.
For example, Beorn found a German map, depicting a plan of how officials would move Jews out of the town and into the ghetto. He then overlaid this map with the data he obtained from the Holocaust Memorial Museum in Washington, D.C.
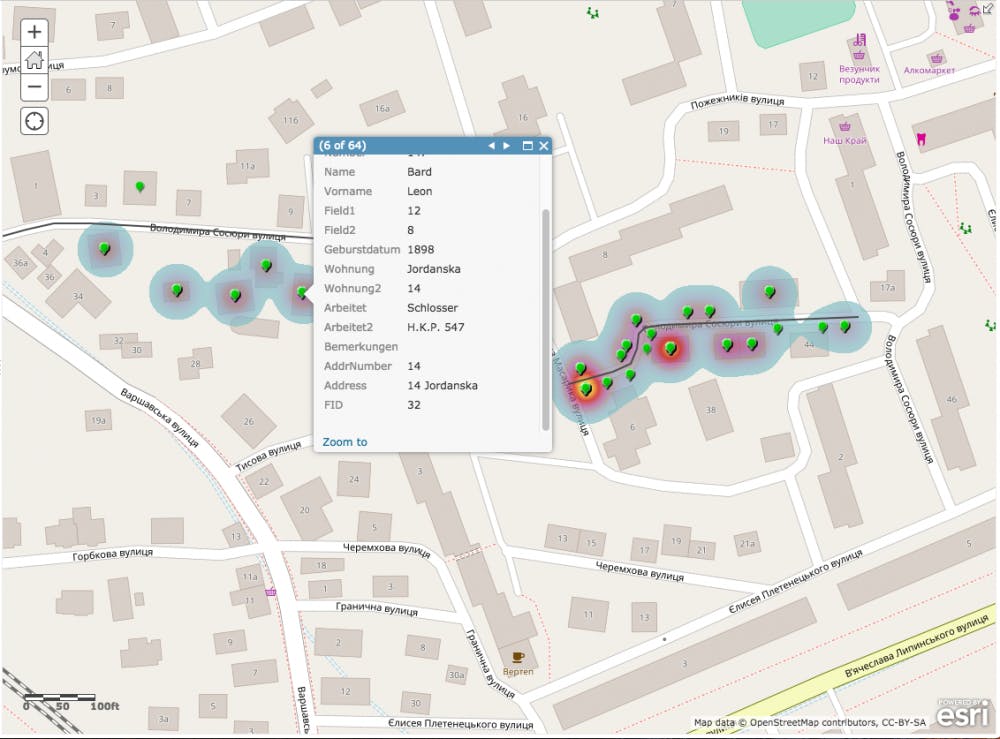
“Then we can do a cluster analysis which is using this heat map … [It] shows us where people are clustered, [in other words], the density,” Beorn said.
According to Beorn, users can click on a point on the cluster map and see how many people were living in that location and also view information about a person, including name, address and occupation.
Beorn said that the next step would be to manipulate this data by searching and adding filters. For example, he said he could search by employer or overlay important buildings — such as the work office or administration building — on the GIS and determine how long it would take someone to get to one of these locations.
According to Beorn, the ability to visualize the data in different ways often generates new questions.
“You can say … Can this person actually make it to a marketplace to buy food in the two hours that they’re given to leave the house? If not, how are they getting food?” Beorn said.
Beorn emphasized the team-oriented nature of his project. He currently has two undergraduate research assistants on his team — second-year College student Matt Poliakoff and third-year College student Ryan Wolfe.
Poliakoff and Wolfe are working on entering information into GIS, such as when deportations happened or when the ghetto opened.
“Hopefully, by the end, the result will be a pretty big interactive map that you can click through and ... See a lot of historical events that occurred throughout this region,” Poliakoff said.
According to Poliakoff and Wolfe, they will be working on the GIS for the next year, expanding on the initial data sets and adding in more specific information.
In January, Beorn, Poliakoff and Wolfe will travel to Washington, D.C. to visit the United States Holocaust Memorial Museum. The group will look through the museum’s archives and analyze documents. Over spring break they will also travel to Lviv, Ukraine. According to Beorn, in Lviv, the team will coordinate with Center for Urban History to go through local archives, reading and interpreting documents and visiting the ghetto again.
Beorn said that one of the things he hopes to get out of the trip — besides gaining a greater insight into primary documents for the projects — is mentoring students in a real-world context.
“This kind of work is a great way to integrate people who are learning the content, but [are] also able to do something,” Beorn said.
Read More

U.Va. Health becomes first health system in Virginia to offer new melanoma treatment
By Vrinda Vashisht | 6 days agoU.Va. Health interventional radiologist Dr. Daniel Sheeran and U.Va. Health Cardiac Anesthesiologist Dr. Paul Gallo helped bring the treatment to U.Va. Health.

Brian Wamhoff discusses goals for Manning Institute as chief strategy and business officer
By Isabela Delgado | July 15, 2026Wamhoff is the third executive member to join the Manning Institute.
Allergy Clinic to close following accreditation review of Student Health and Wellness
By Ruby Budetti | July 12, 2026The decision follows a review of SHW by the Accreditation Association for Ambulatory Health Care.